
Work About Contact Request a briefing
ENRU

Work we can show you.

Four projects, all delivered in Central Asia, all validated against observations collected in the field. Every figure below comes from the delivered analysis.

Water · Qashqadaryo, UZ & Zhambyl, KZ

Irrigation efficiency audit

Water productivity scored for every field across 788,000 hectares, and the underperformers put on a map.

Coverage
788,000 ha
Fields mapped
179,000+
Below 50% efficiency
44,100
Sensors
Landsat 8/9
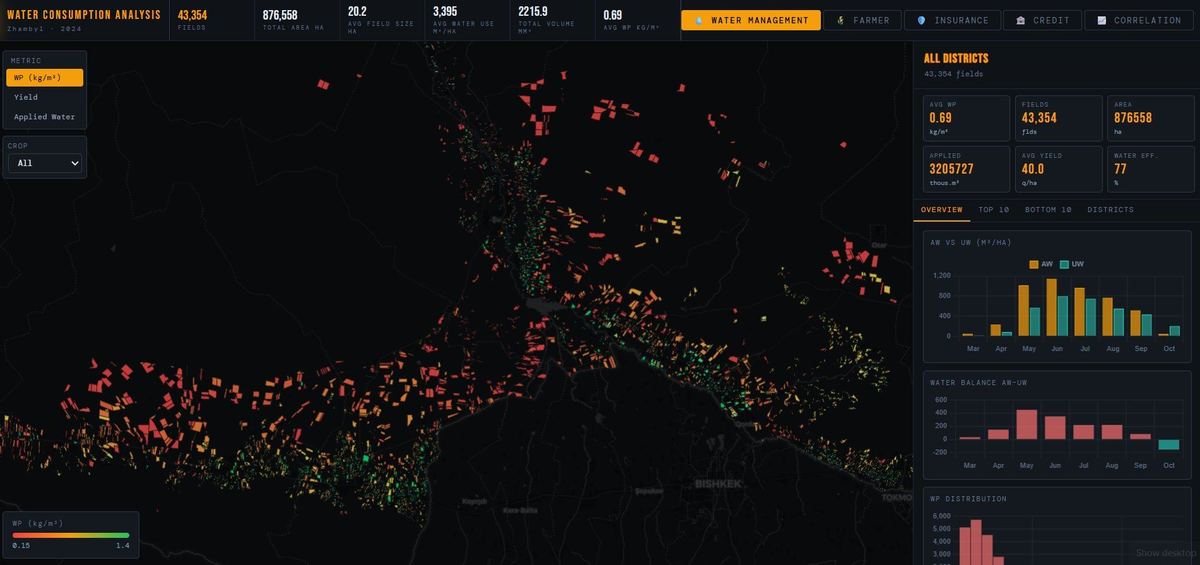
Water consumption analysis — Zhambyl Oblast, 43,354 fields
GEOBOX water consumption analysis for Zhambyl Oblast, Kazakhstan: 43,354 fields plotted by water productivity with monthly water balance charts

The situation

Regional water authorities allocate by plan and report by plan. Nobody could say which districts were genuinely losing water and which were simply under-reporting it.

What we did

We derived actual evapotranspiration per parcel and set it against applied water, producing a water productivity index for every field, then rolled the results up into district-level benchmarks.

What it produced

More than 179,000 fields scored. 44,100 of them fall below the 50% efficiency threshold and can be found on a map. District benchmarks were delivered to the regional water authorities.

ETa / applied water788k haLandsat 8/9QashqadaryoZhambyl

Pest risk · Southern Kazakhstan

Locust outbreak forecasting

Two independent outbreak pathways, separated — and flagged by district before the season starts.

Field records
5,440
Seasons
2019–2023
Species
3
Climate input
ERA5
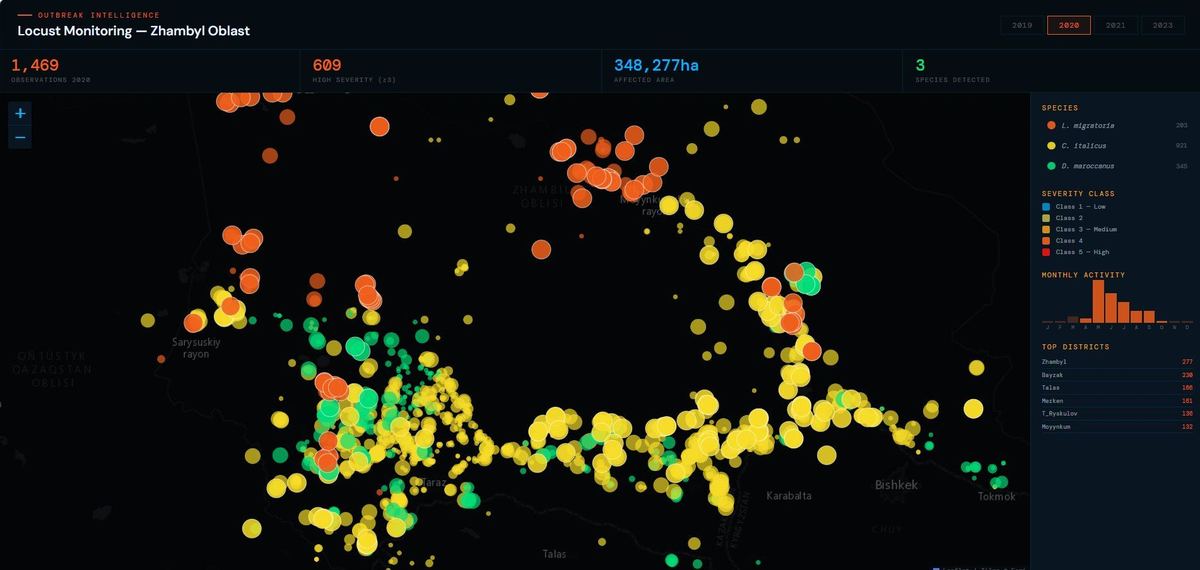
Outbreak intelligence — locust monitoring, Zhambyl Oblast
GEOBOX locust monitoring map of Zhambyl Oblast showing 1,469 observations by species and severity class across 348,277 hectares of affected area

The situation

Locust response in the region is reactive. Teams mobilise once swarms are visible, by which point the cheap window has closed and the expensive one is all that remains.

What we did

A two-component risk model — habitat suitability multiplied by a climate stress anomaly — trained on 5,440 field records covering three species and five seasons.

What it produced

The model separated two independent outbreak pathways: 2023 driven by drought, 2020 by heat. Risk surfaces are produced ahead of the season, by district, with severity classes attached.

Habitat suitability5,440 records2019–2023ERA53 species

Agriculture · South Kazakhstan

Crop classification & field mapping

92,293 parcels classified into ten crop types, with irrigated land separated from rainfed.

Parcels
92,293
Crop classes
10
Sensors
Sentinel-1/2
Segmentation
Irrigated vs rainfed
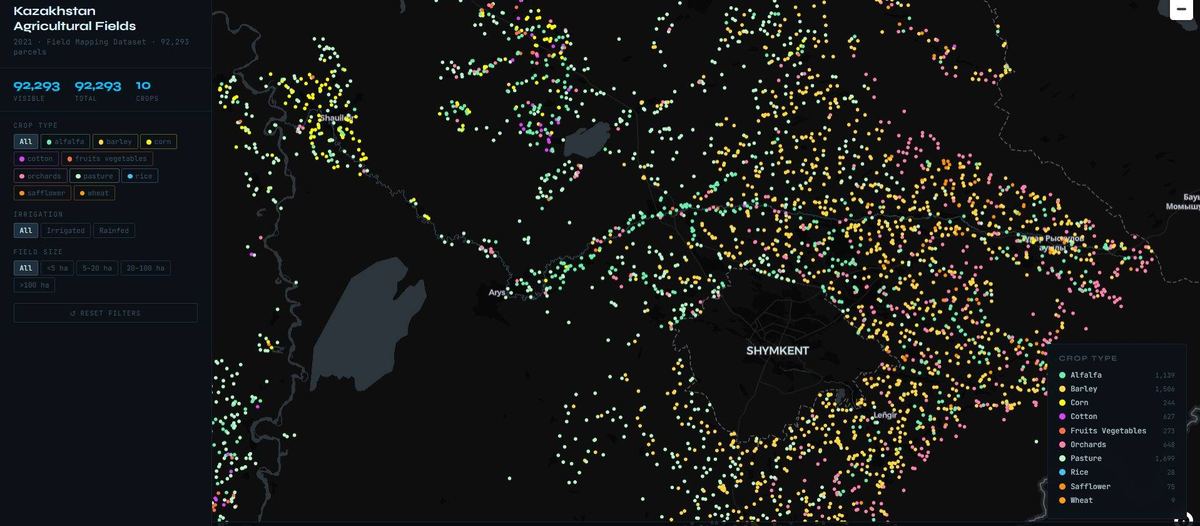
Kazakhstan agricultural fields — 92,293 parcels, 10 crop classes
GEOBOX crop classification map around Shymkent, Kazakhstan, showing 92,293 agricultural parcels coloured by ten crop types

The situation

Parcel-level crop information in the region is out of date, self-reported, or both — which turns lending, insurance and water planning into educated guesswork.

What we did

Multi-temporal NDVI fused with SAR backscatter, classified at field-polygon level so the output is a parcel with attributes rather than a raster of pixels.

What it produced

92,293 parcels classified across ten crop classes, with irrigated and rainfed land separated — the base layer that subsequent water and yield work is built on.

NDVI + SAR92,293 parcels10 classesSentinel-1/2Field polygons

Urban heat · Almaty, KZ

Оазис-метр — Almaty urban heat platform

A city classified from Oasis to Inferno, with a per-building index and an intervention calculator behind it.

Zones
5 climate classes
Index
GIGA, per building
Inputs
Landsat 8/9 + ERA5
Built for
Almaty urban planning
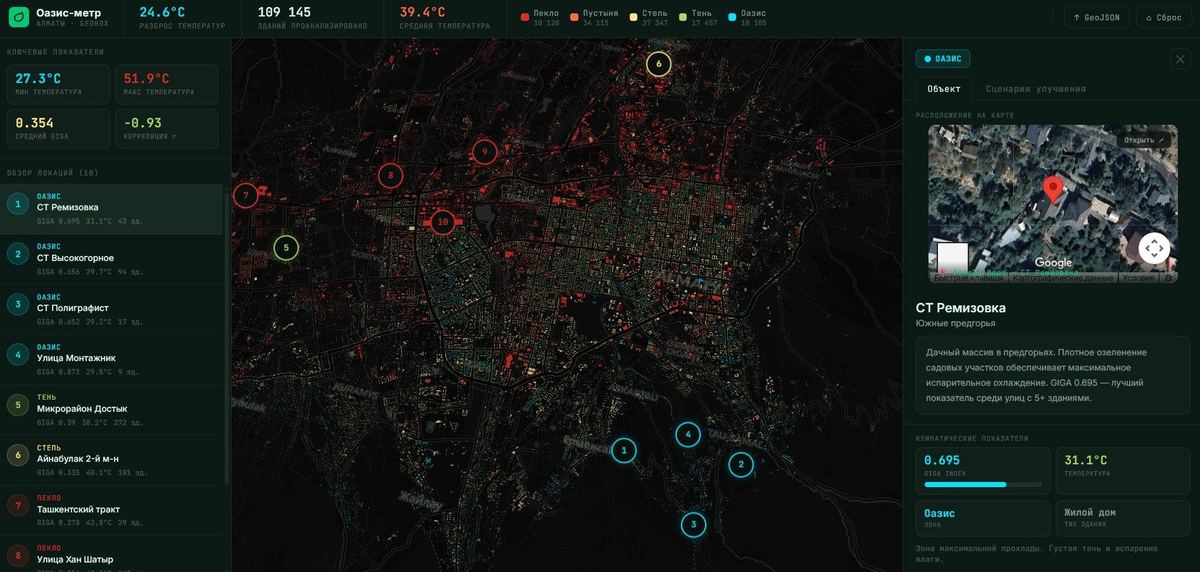
Оазис-метр — thermal comfort, Almaty
The GEOBOX Oasis-meter platform for Almaty showing thermal comfort zones across the city with per-site temperature and comfort index readings

The situation

Almaty gets hotter every summer, and the planning debate was running on intuition: which streets, which courtyards, which buildings actually need the intervention.

What we did

We classified the city into five thermal comfort zones, from Oasis to Inferno, computed a GIGA index for individual buildings, and built an intervention calculator with a city-scale optimiser on top.

What it produced

Planners can price a cooling intervention before it is funded, and see which blocks return the most degrees per tenge spent.

LST · emissivityGIGA indexLandsat 8/9ERA55 zones

Work with us

Tell us the decision. We will tell you what the data can carry.

Auditing an irrigation network, underwriting a season, forecasting an outbreak, cooling a city — we start from the decision in front of you, not from a platform demo.